
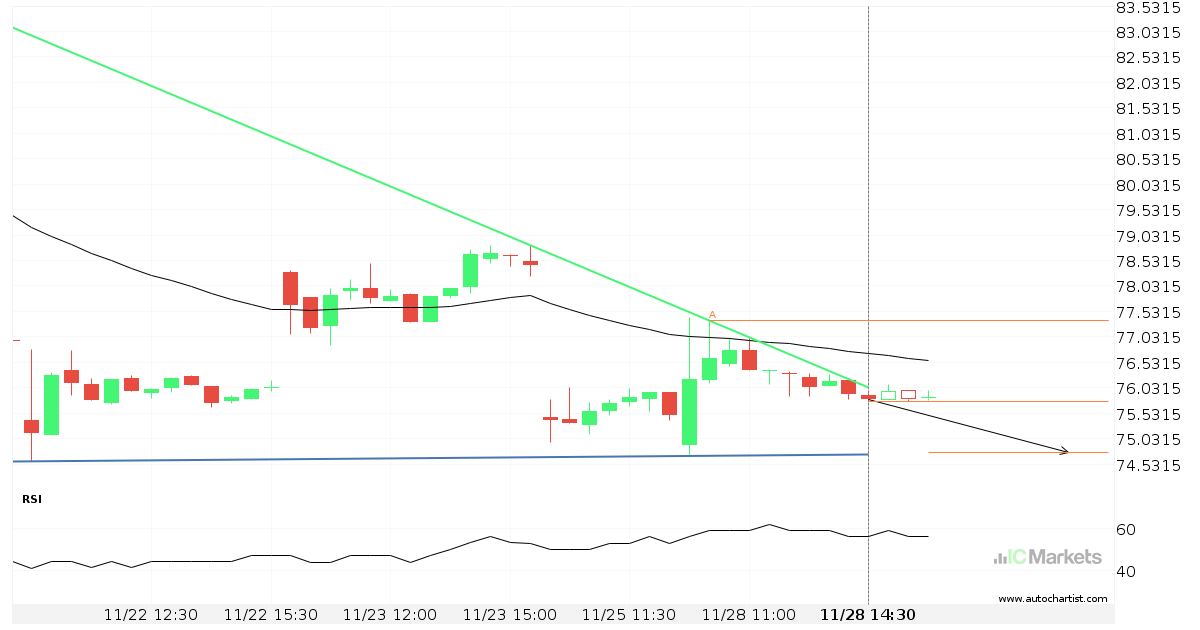
Alibaba Group Holding Limited – acercándose a el soporte del Triángulo descendiente
El Alibaba Group Holding Limited avanza hacia una línea de soporte. Como le hemos visto retroceder desde esta línea anteriormente, podríamos presenciar, o bien, una ruptura a través de esta línea o una recuperación a los niveles actuales. Ha llegado a esta línea en numerosas ocasiones en los últimos 12 días y puede probarla de […]
Posible ruptura del nivel de soporte en el US Tech 100 Index
El US Tech 100 Index avanza hacia la línea de soporte de un Cuña descendente, que ya ha probado varias veces en el pasado. Hemos visto un retroceso antes desde esta línea, así que en esta etapa no está claro si atravesará esta línea o se recuperará como lo ha hecho anteriormente. Si el US […]
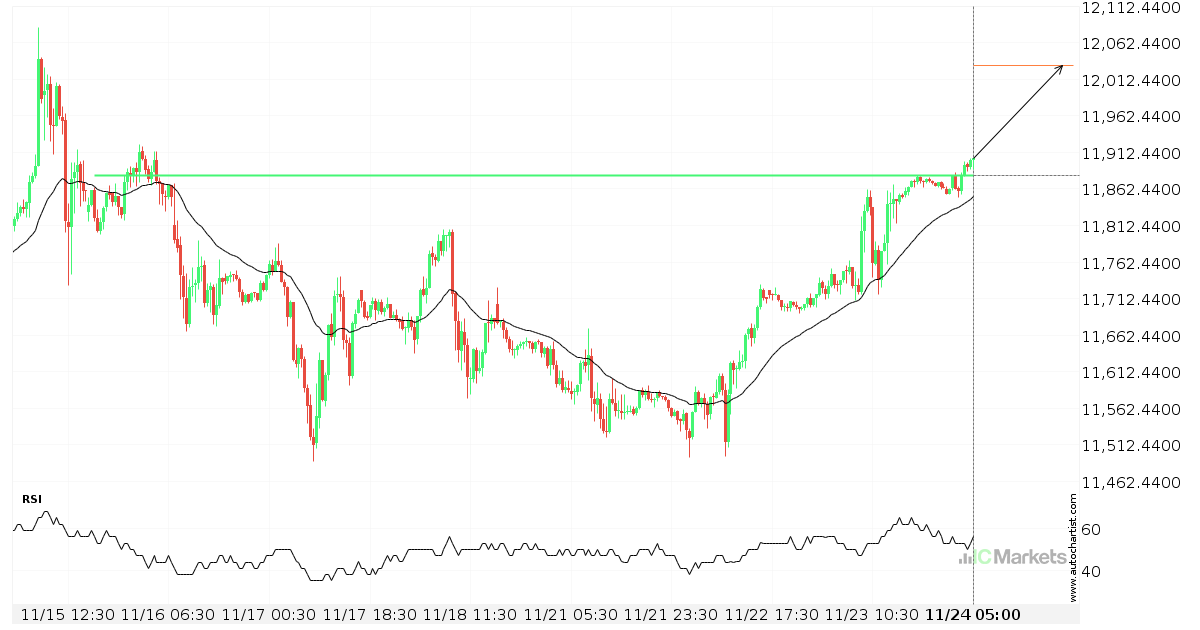
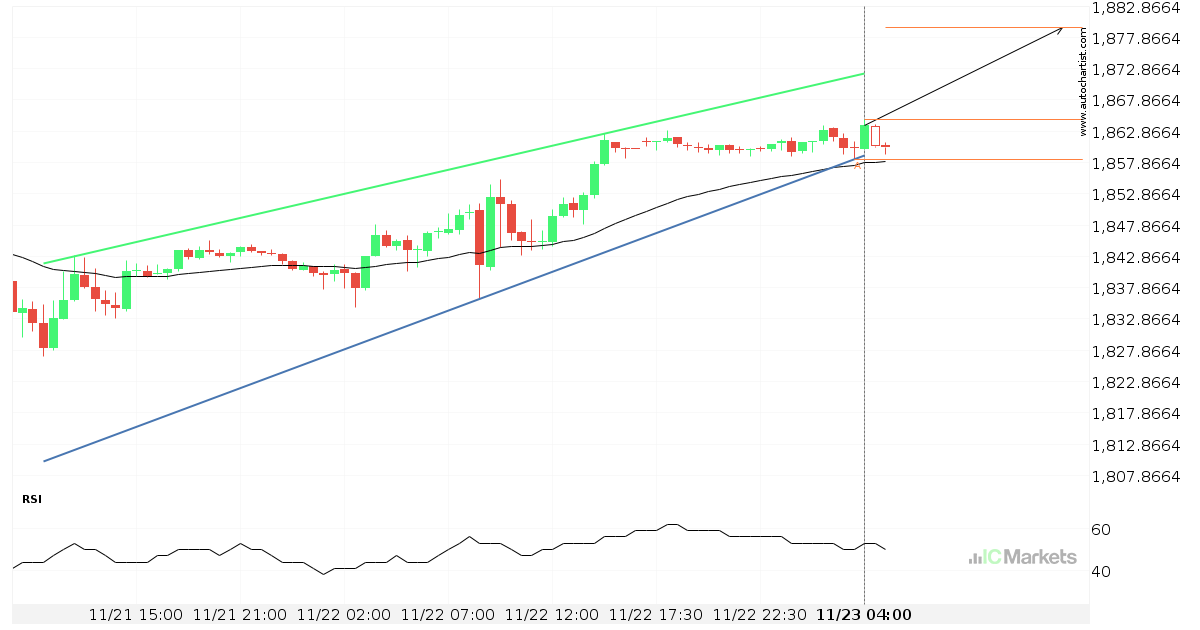
Posible comienzo de una tendencia alcista en el US Tech 100 Index
El US Tech 100 Index ha atravesado una línea de 11862.9004. Si esta rotura se mantiene, podríamos ver el precio del US Tech 100 Index dirigiéndose al nivel de 12005.8799 en las próximas 2 días. Pero no debe apresurarse a la hora de operar, porque ya ha probado esta línea en numerosas ocasiones durante el […]
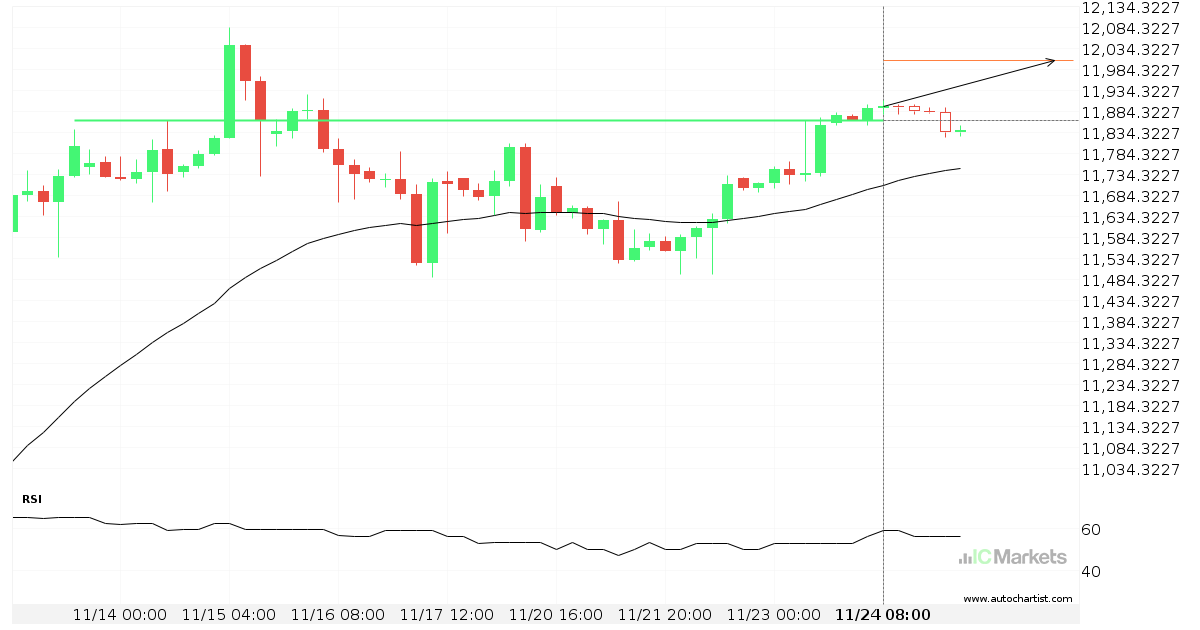
El US Tech 100 Index atravesó la importante línea de precio de 11880.2002
El US Tech 100 Index atravesó una línea de resistencia. Ha entrado en contacto con esta línea en numerosas ocasiones en los últimos 9 días. Esta irrupción muestra un movimiento potencial hacia el nivel de 12031.6299 dentro de las próximas 2 días. Ya hemos observado un retroceso desde esta posición en el pasado, por tanto, […]
Posible ruptura del nivel de resistencia en el US Small Cap 2000 Index
El US Small Cap 2000 Index avanza hacia la línea de resistencia de un Cuña ascendente, que ya ha probado varias veces en el pasado. Hemos visto un retroceso antes desde esta línea, así que en esta etapa no está claro si atravesará esta línea o se recuperará como lo ha hecho anteriormente. Si el […]
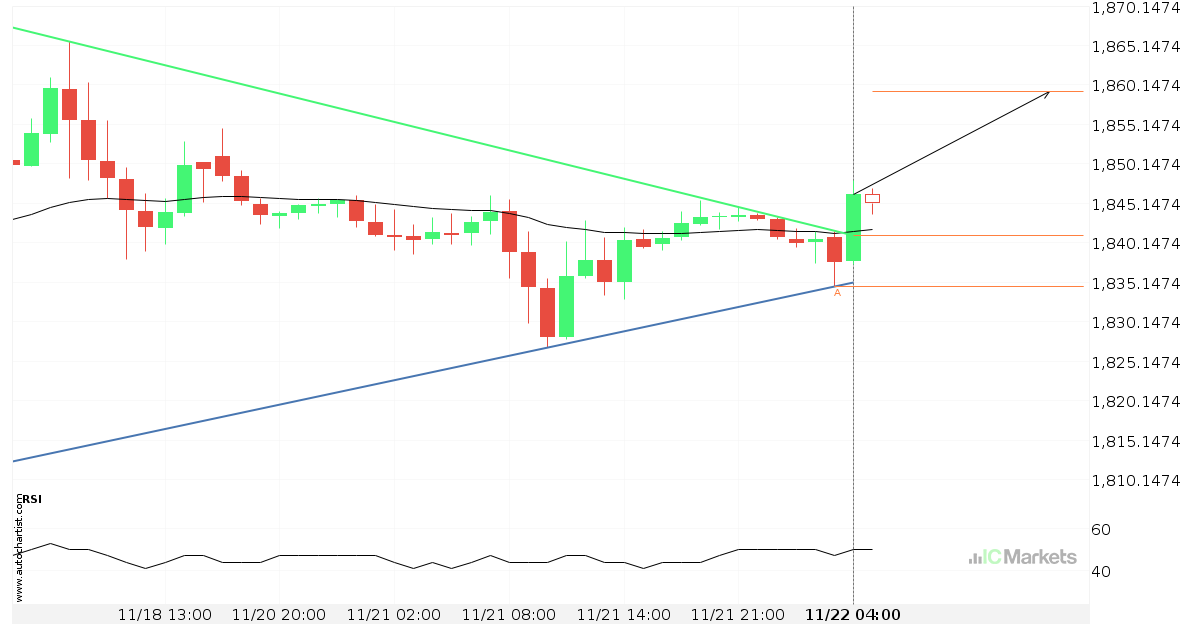
La línea de resistencia ha sido irrumpida por el US Small Cap 2000 Index
El US Small Cap 2000 Index ha atravesado la línea de resistencia, que ya se ha probado dos veces en el pasado. Hemos visto, anteriormente, un retroceso desde esta posición, así que debemos esperar la confirmación de la ruptura antes de operar. Si esta nueva tendencia persiste, un nivel objetivo alrededor de 1859.2883 podría materializarse […]

El US SPX 500 Index atravesó la importante línea de precio de 3946.3999
El US SPX 500 Index atravesó una línea de soporte. Ha entrado en contacto con esta línea en numerosas ocasiones en los últimos 4 días. Esta irrupción muestra un movimiento potencial hacia el nivel de 3927.3501 dentro de las próximas 6 horas. Ya hemos observado un retroceso desde esta posición en el pasado, por tanto, […]
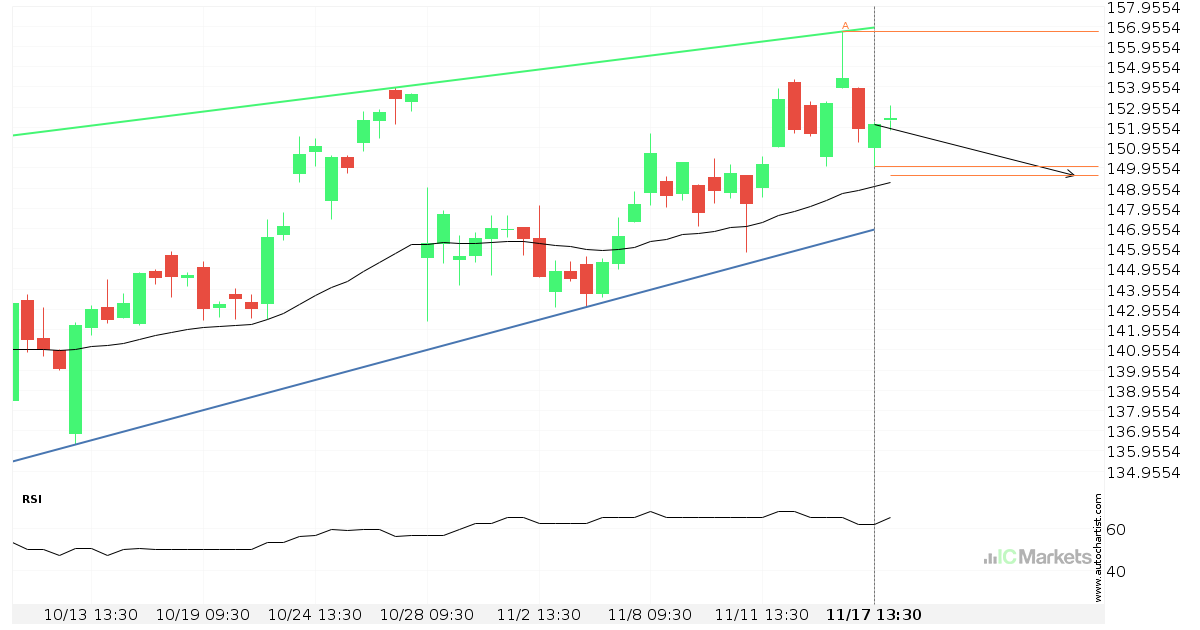
Posible ruptura del nivel de soporte en el AbbVie
El AbbVie avanza hacia la línea de soporte de un Cuña ascendente, que ya ha probado varias veces en el pasado. Hemos visto un retroceso antes desde esta línea, así que en esta etapa no está claro si atravesará esta línea o se recuperará como lo ha hecho anteriormente. Si el AbbVie continúa con esta […]
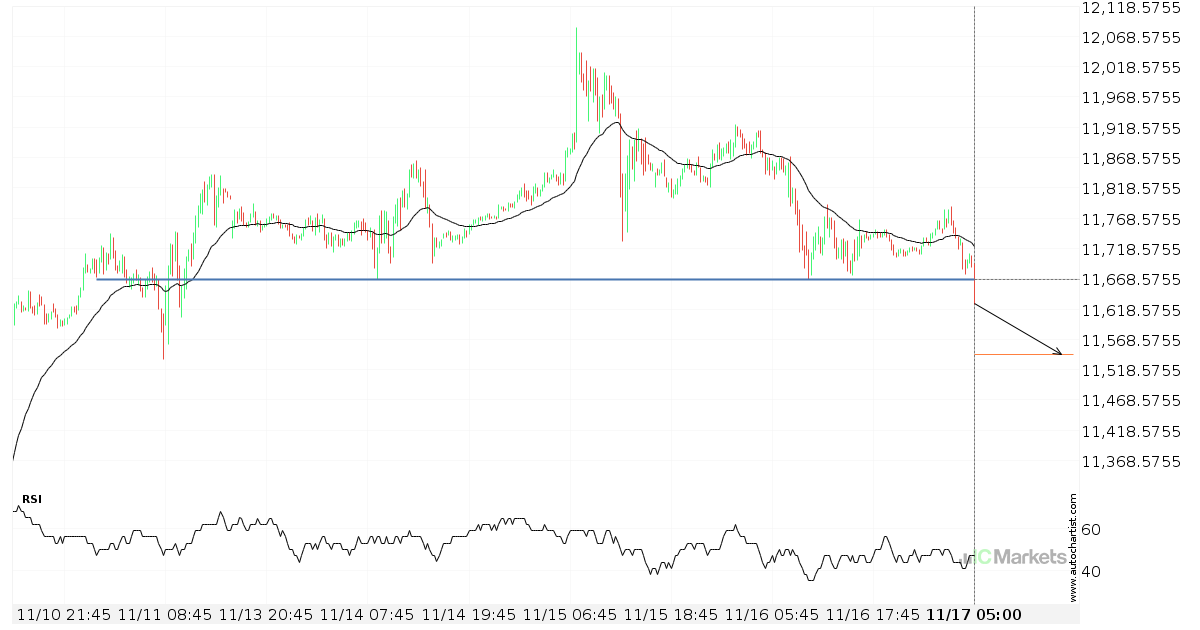
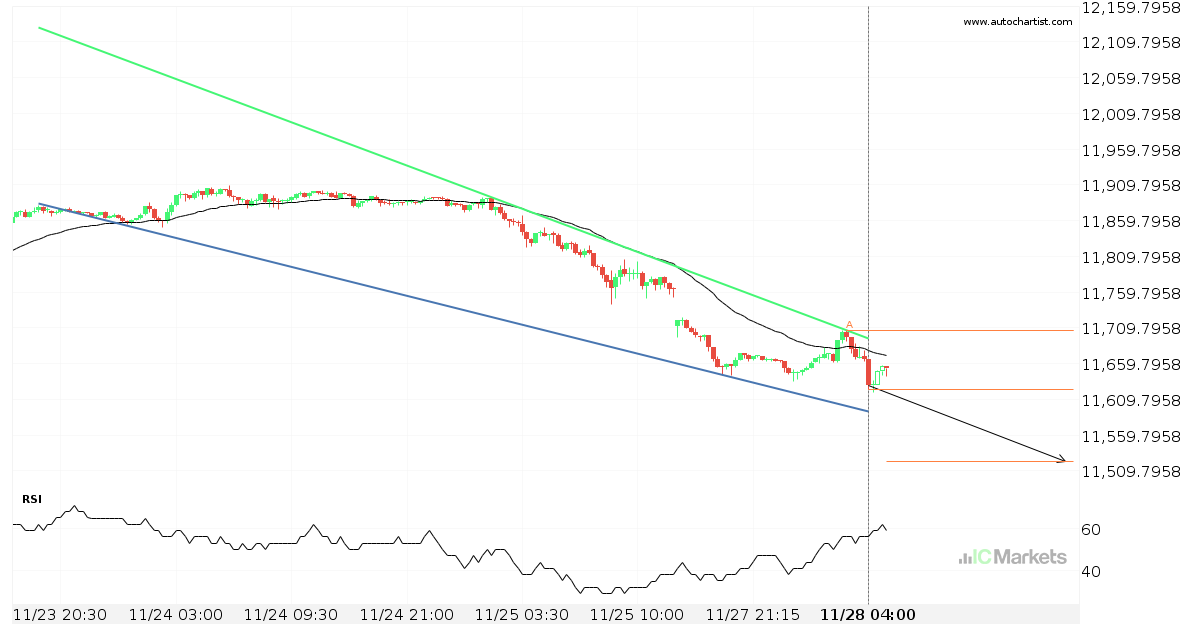
El US Tech 100 Index atravesó la importante línea de precio de 11667.0000
El US Tech 100 Index atravesó una línea de soporte. Ha entrado en contacto con esta línea en numerosas ocasiones en los últimos 7 días. Esta irrupción muestra un movimiento potencial hacia el nivel de 11544.1602 dentro de las próximas 2 días. Ya hemos observado un retroceso desde esta posición en el pasado, por tanto, […]

¿Qué está ocurriendo con el Meta Platforms, Inc. – Class A Common Stock?
Aquellos de ustedes que sean seguidores de tendencias probablemente estarán observando ansiosamente Meta Platforms, Inc. – Class A Common Stock para comprobar si el último movimiento de un 25,79% continúa. Si no lo hace, las personas fieles al método de reversión a la media estarán encantadas con este excepcionalmente gran movimiento de 12 días.